Sugar Makers Harvest
It All Starts With Ū
The complete maple syrup production app — built by a sugarmaker, for sugarmakers. Track every tap, every sap run, every boil, and every bottle from the first thaw to the finished jar.
Where it all starts
Your Sugarbush. Your Identity.
Before a single tap goes in the tree, SHMU asks you to establish who you are and where you operate. That identity is the key that separates everything — every journal entry, every screen, every season.
01
Interactive Sugarbush Map
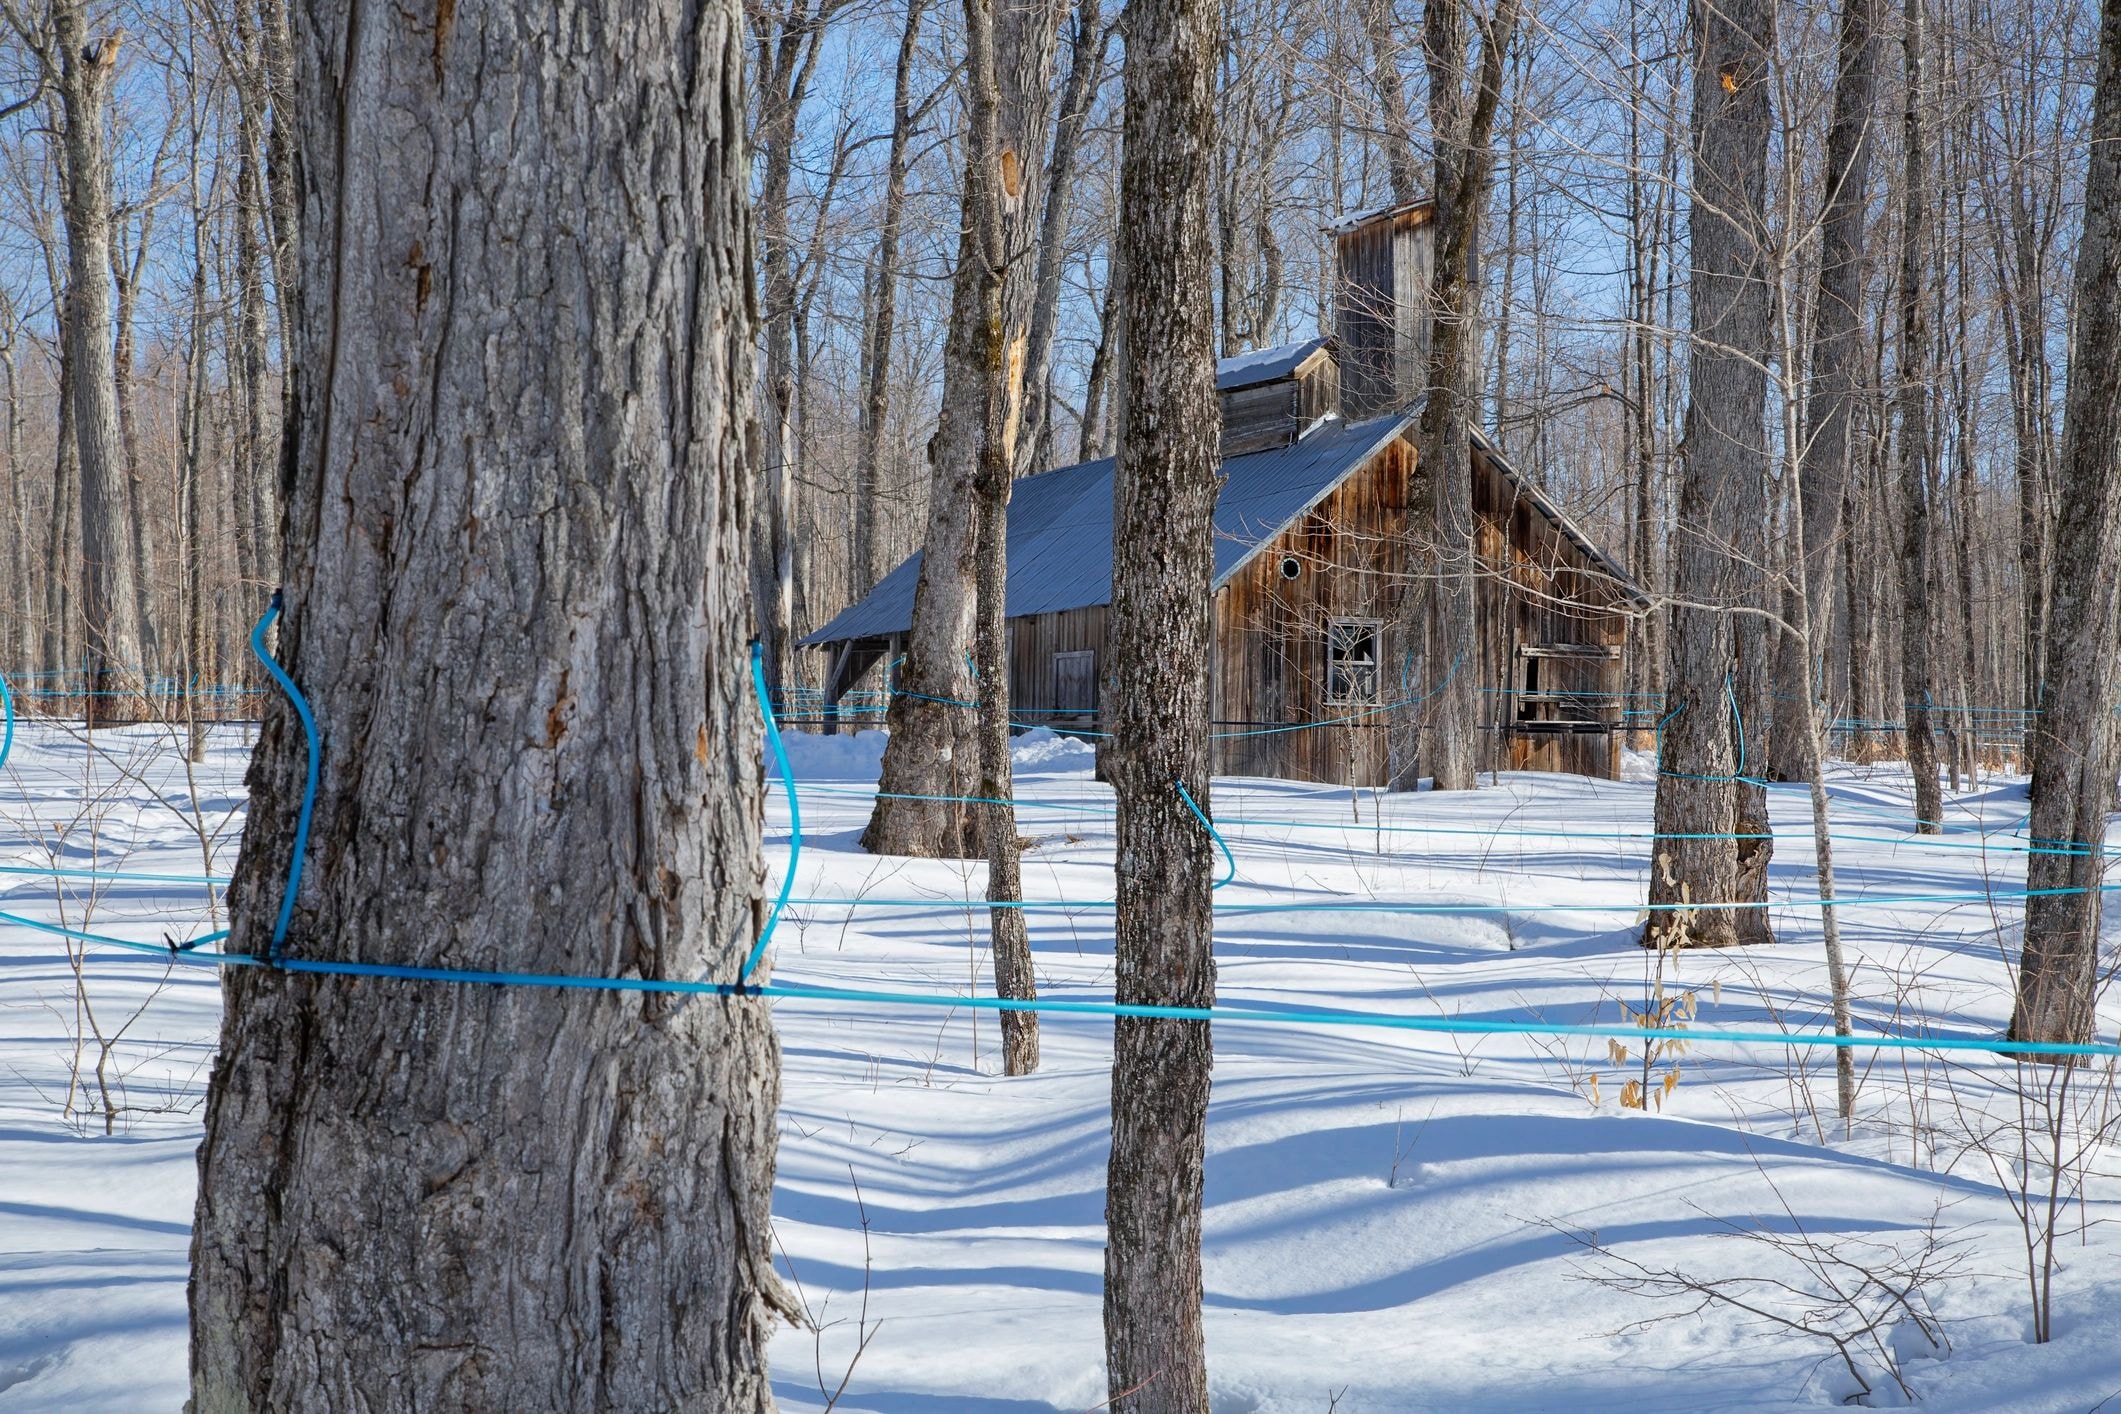
The first tab is an interactive map of all your sugarbushes. Drop a pin on your exact location — and if the map doesn't place it close enough, drag it to where it belongs. Each sugarbush gets its own identity: a name, a location, and a record that follows it through every screen in the app.
Every sugarbush on the map is color-coded by tier — a visual system based on your tap count that tells you at a glance how large each operation is. Whether you're running 5 taps or 25,000, your sugarbush lands in the right tier automatically. The tier updates as your tap count grows, so the map always reflects where your operation actually stands.
02
Weather Panel, Tasks & Notes
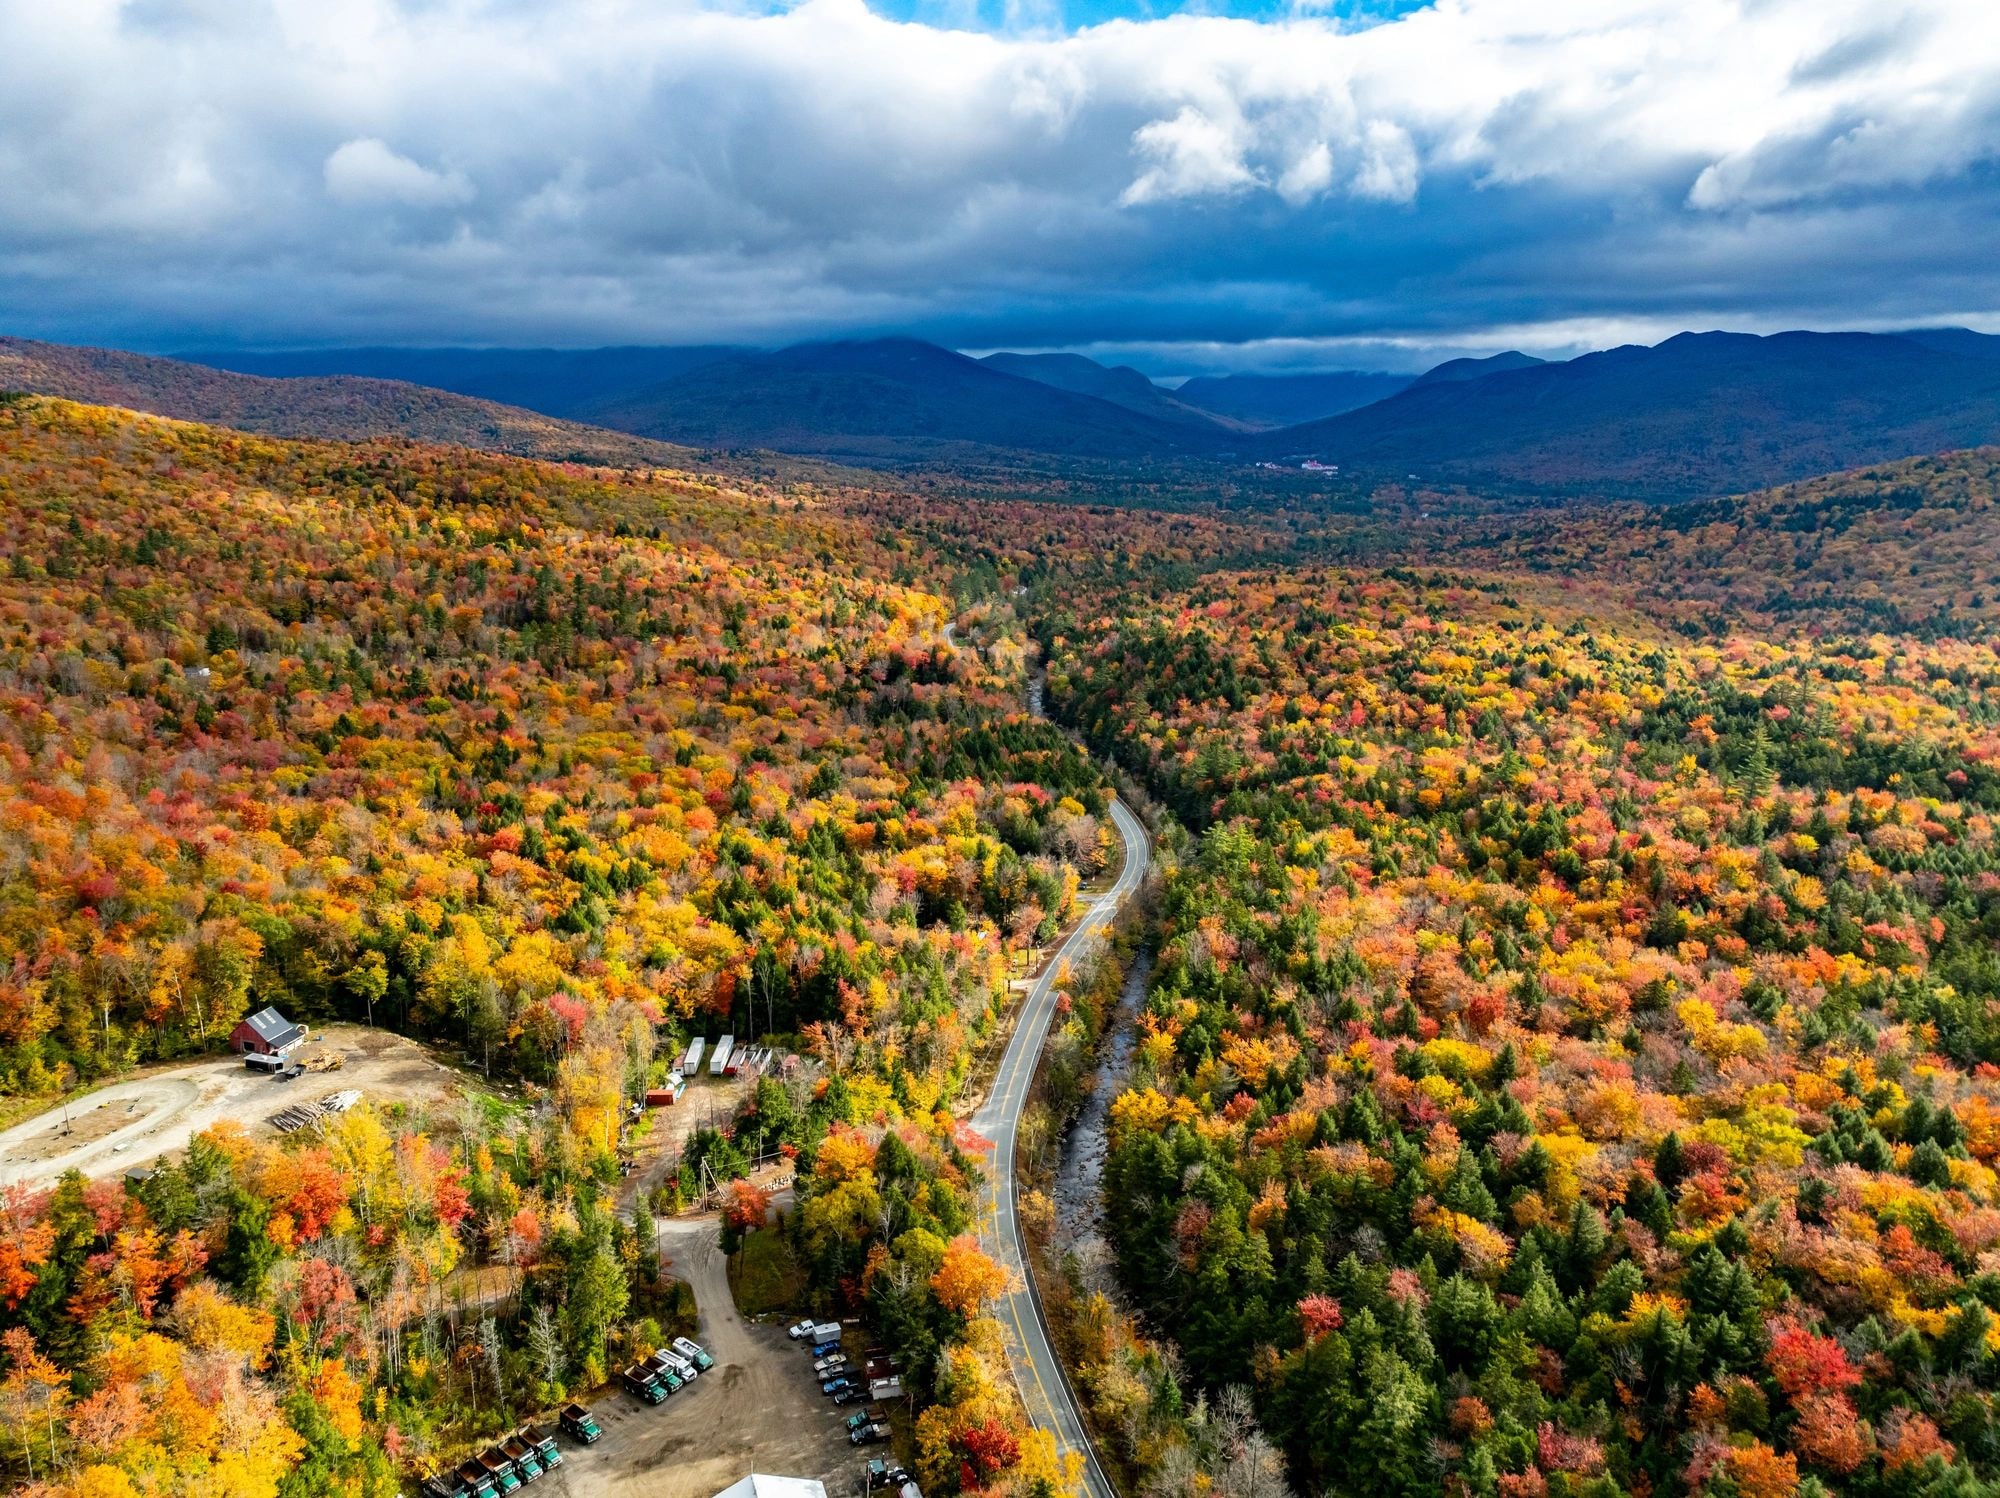
The second tab is your daily command center. Record your high and low temperatures for the day — critical data for understanding your sap runs and planning your season. A printable bar chart visualizes your temperature swings over time so you can see the freeze-thaw cycles that drive the whole operation. Alongside the weather panel, this tab holds your tasks, notes, and media — photos and videos tied directly to that day and that sugarbush.

03
Fuel Tracking — No Burn, No Syrup
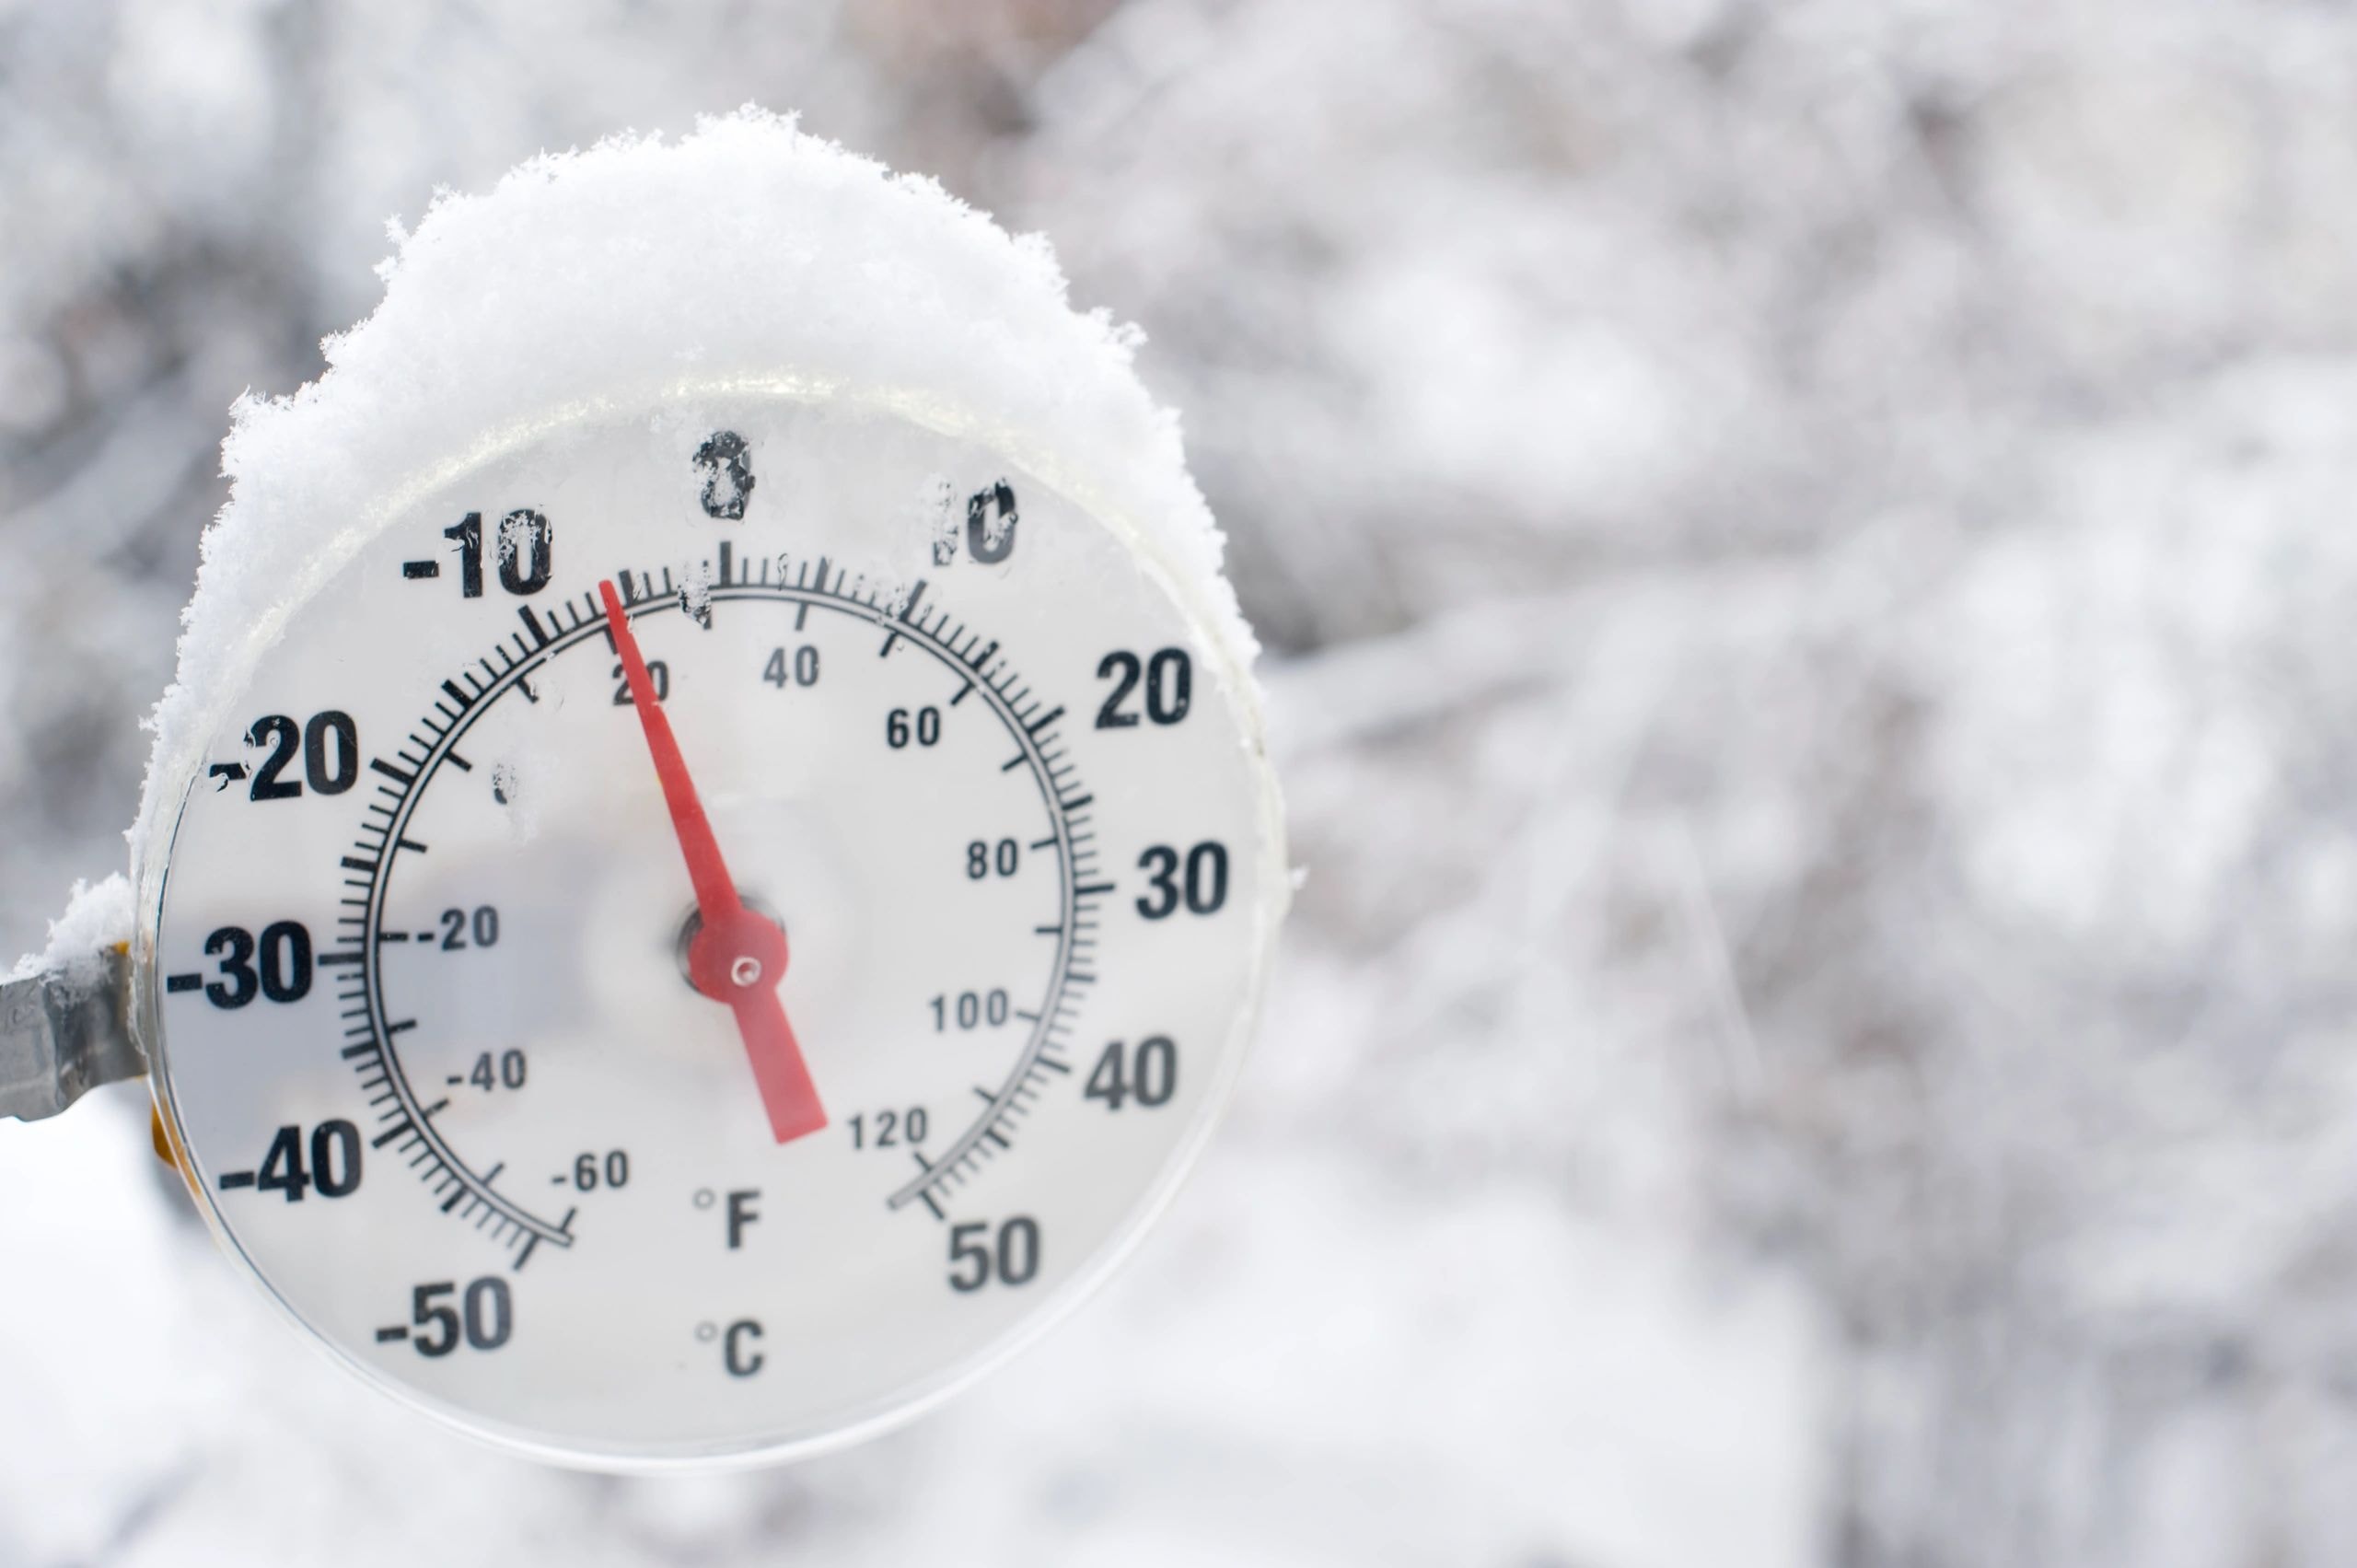
The third tab tracks the fuel that makes everything possible. Enter how much firewood you have at the start of a burn and how much remains when you're done — SHMU calculates your usage automatically, both daily and across the full season. SHMU also tracks propane, oil, electric, and a fully customizable other fuel type — whatever your operation runs on, every unit consumed is recorded and accounted for.
04
Tap Management
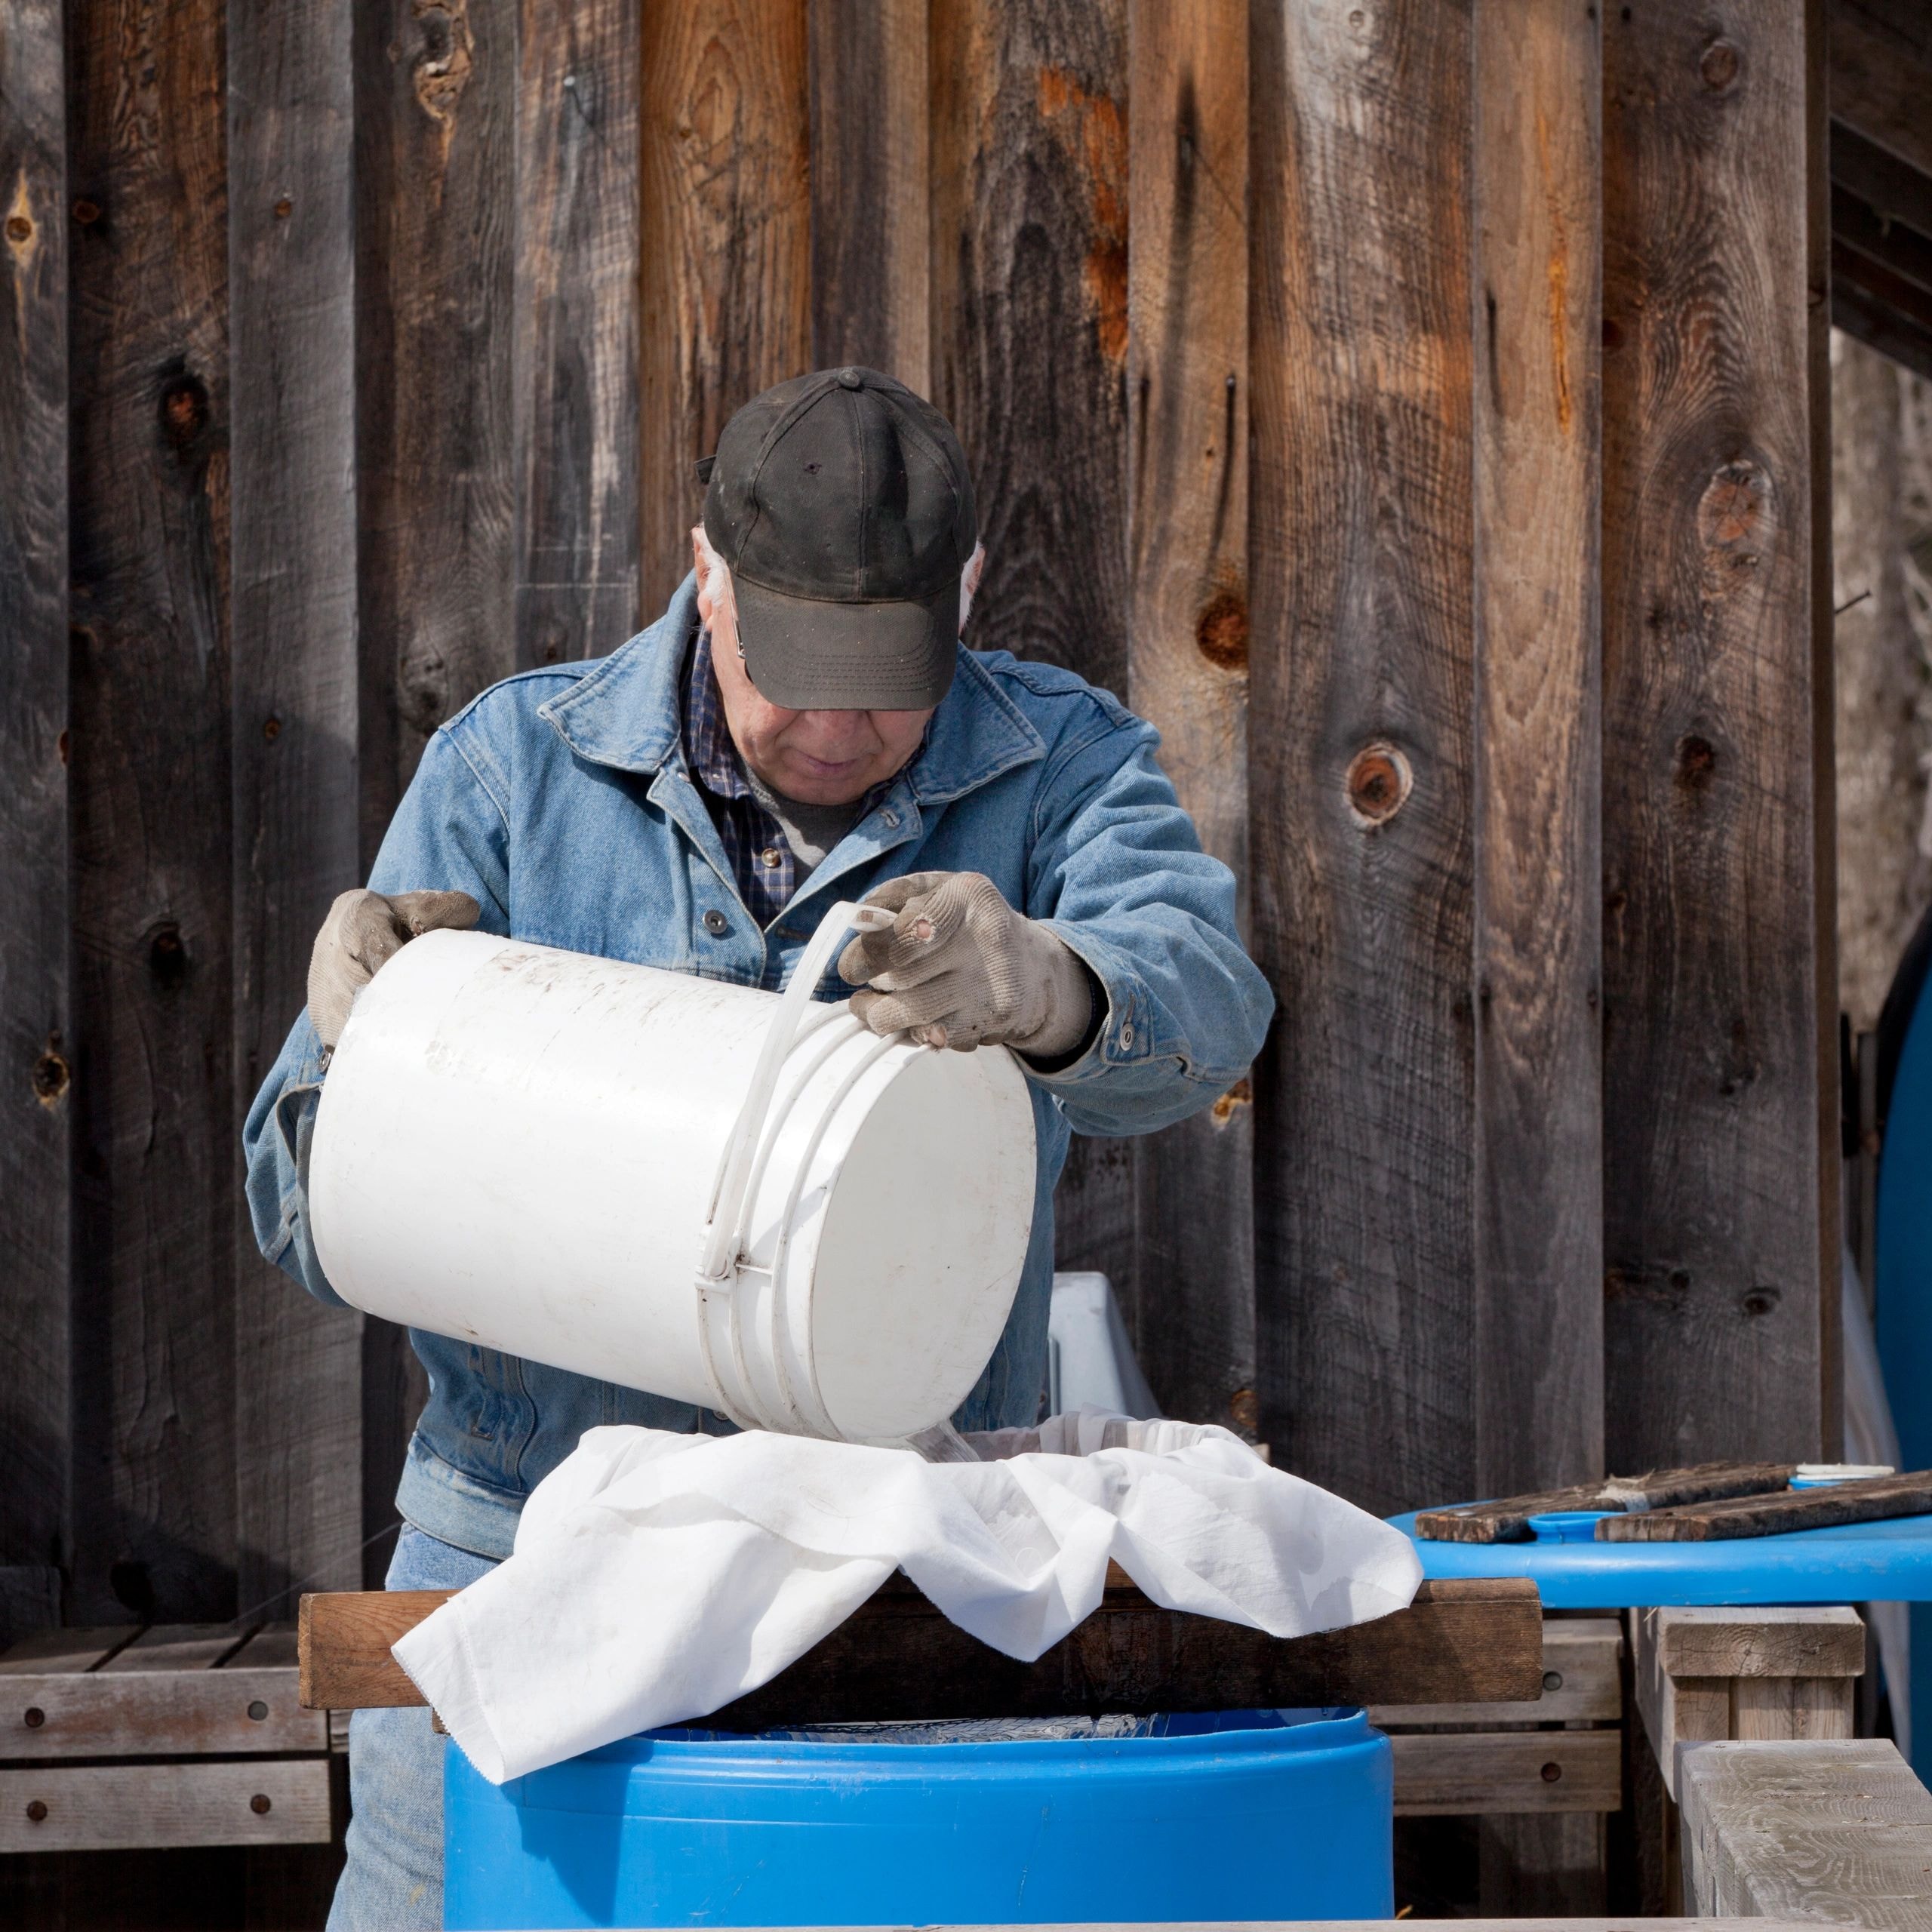
The fourth tab is where your taps live. Record every tap you set — the tap size, the line it feeds, and the date it went in. Choose your collection method: hand collection from bags or buckets, gravity feed systems, or a gravity feed that converts automatically to a pump system when conditions call for it. SHMU tracks your tap count across your entire sugarbush so you always know exactly how many taps are working for you. When a tap comes out, log it. Your tap history becomes part of your season record.
05
Sap Collection
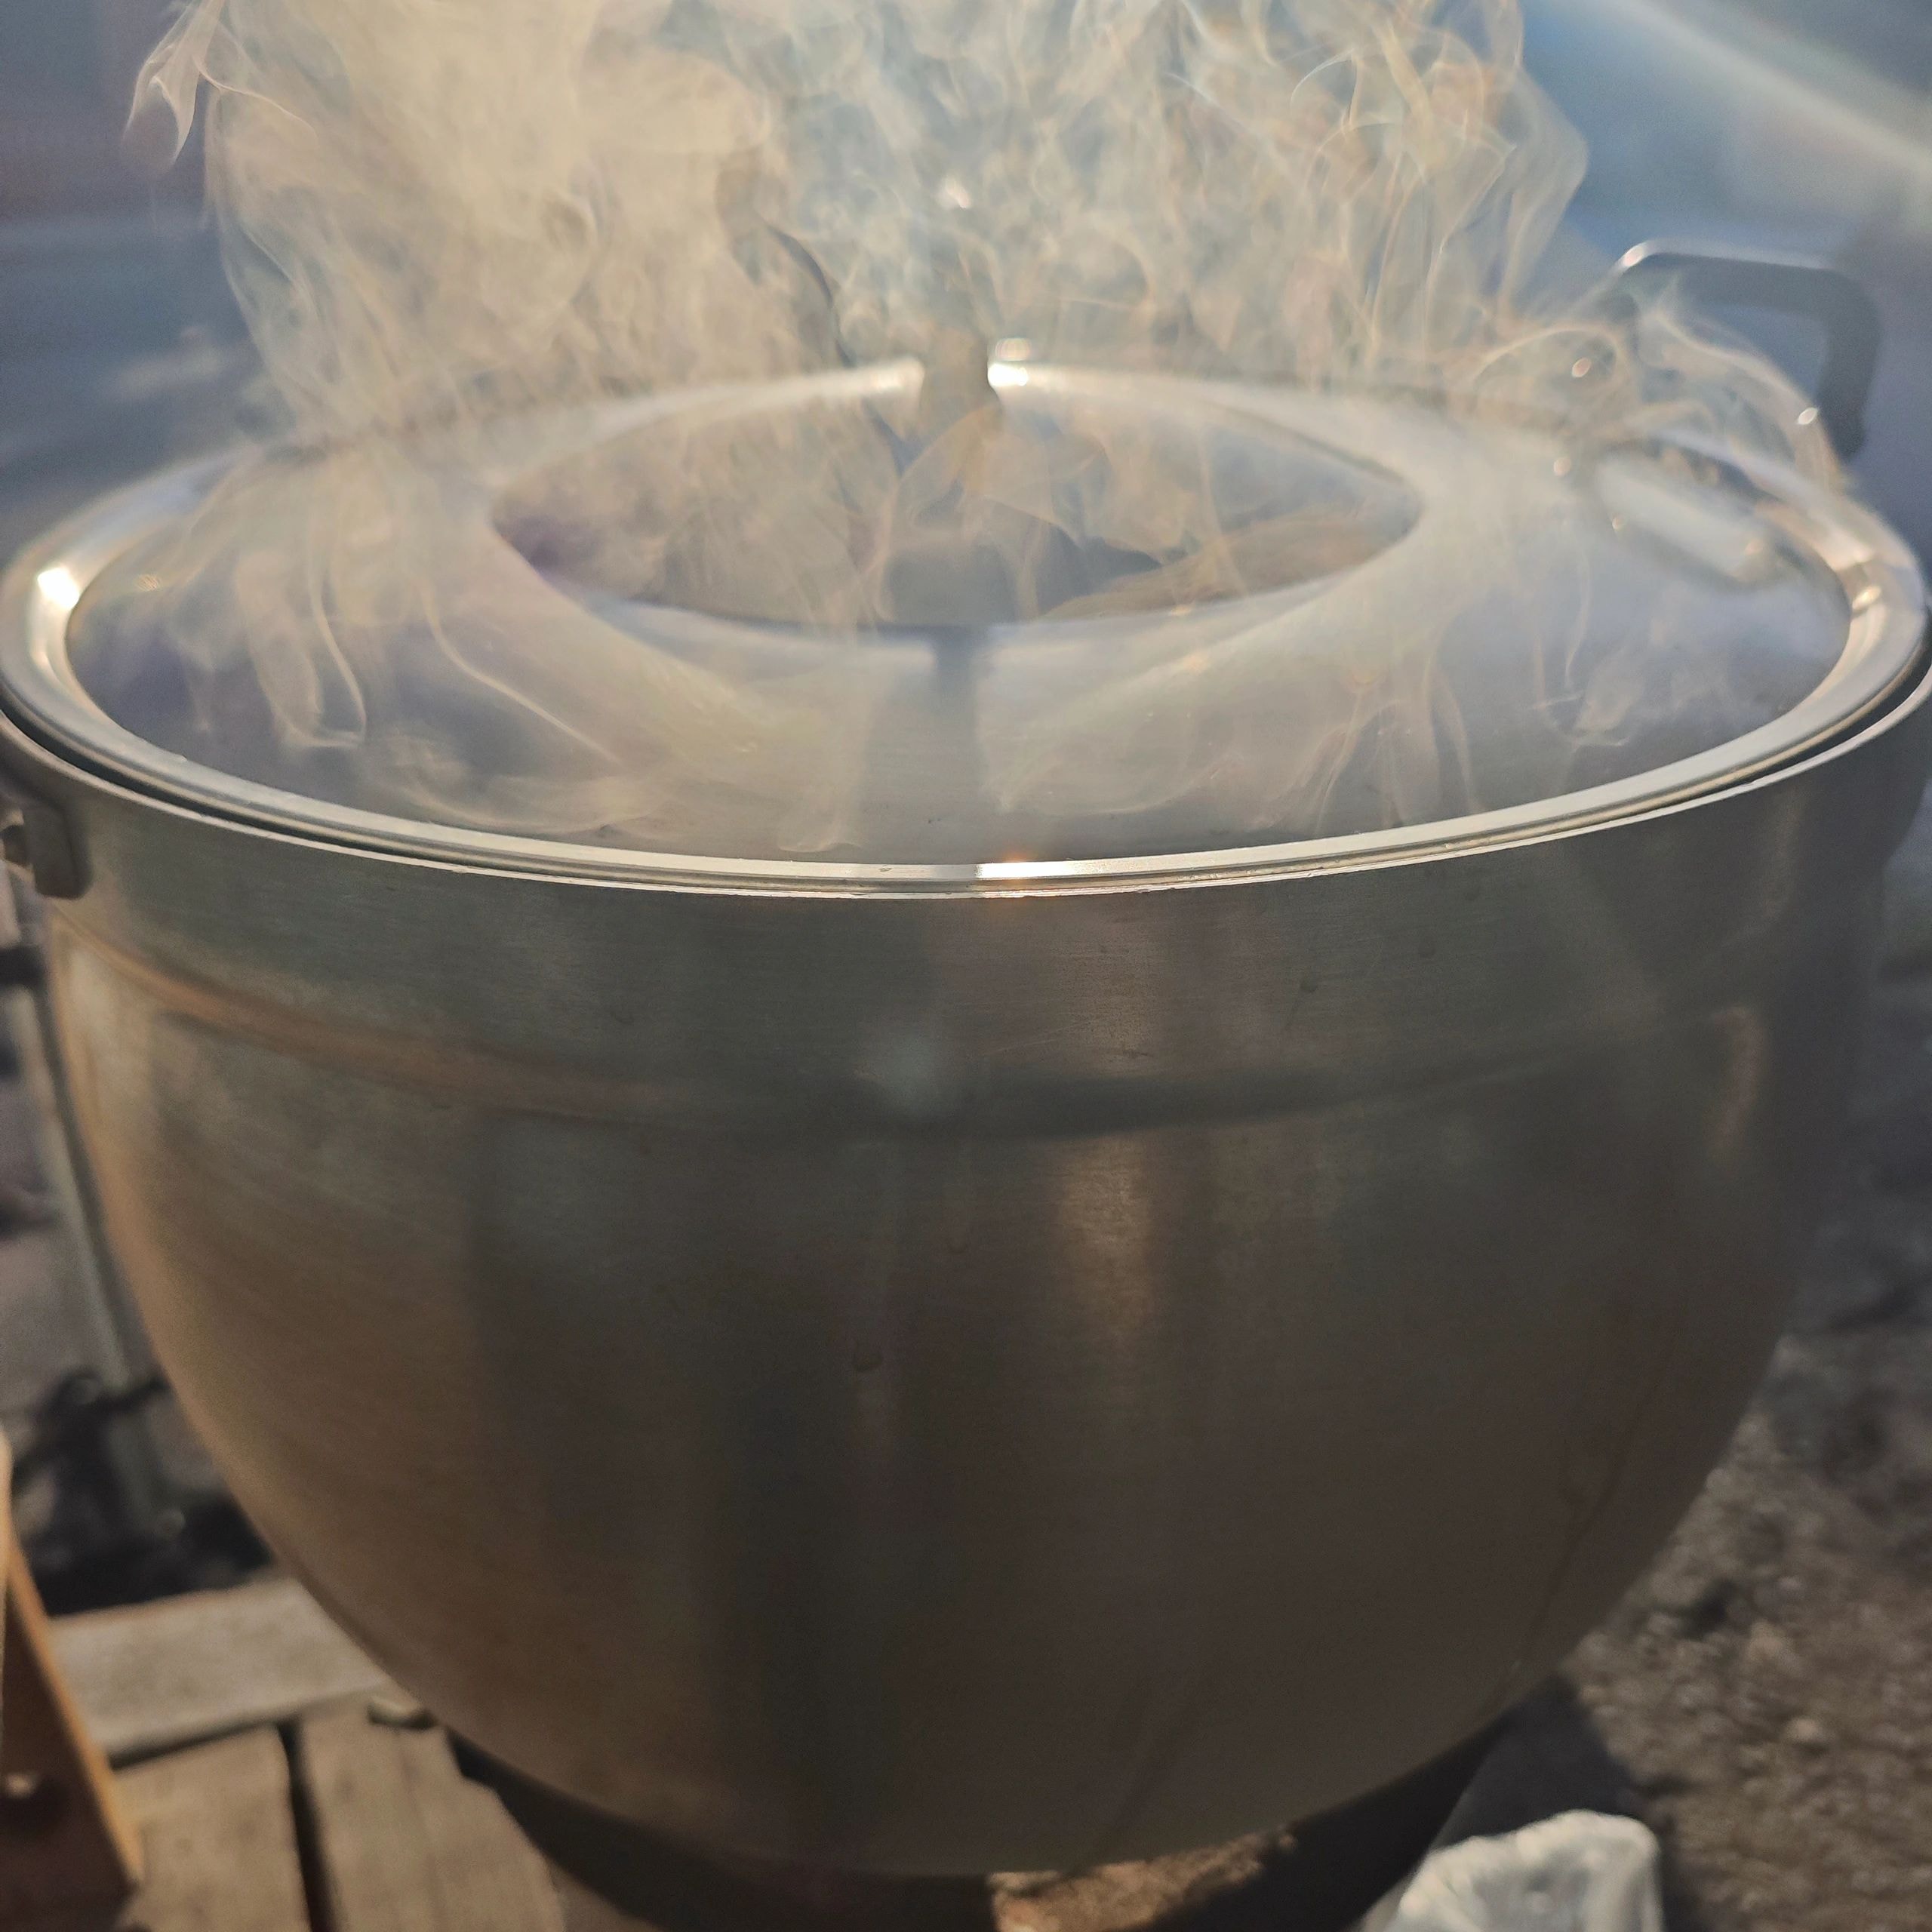
The fifth tab tracks every sap collection run. Enter the date, the volume collected, and the sugar content — SHMU does the math. Your daily and cumulative sap totals build automatically, giving you a running picture of how your season is performing against previous years. Every gallon in is accounted for.
06
Reverse Osmosis
If your operation runs a reverse osmosis unit, SHMU tracks it. Log your incoming sap volume, your concentrate output, and your permeate. SHMU calculates your concentration ratio and tracks how much water your RO removed — critical data for understanding your evaporator load and your fuel efficiency. Every run through the RO is recorded and tied to your season totals.


07
Evaporation
The evaporation tab is where your boils live. Log every boil session — the sap volume in, the syrup volume out, the start and end time, and the draw-off density. SHMU calculates your evaporation rate and your sap-to-syrup ratio for each boil automatically. Over the course of a season, these numbers tell you exactly how your evaporator is performing and where your efficiency gains are hiding.
08
Filtering
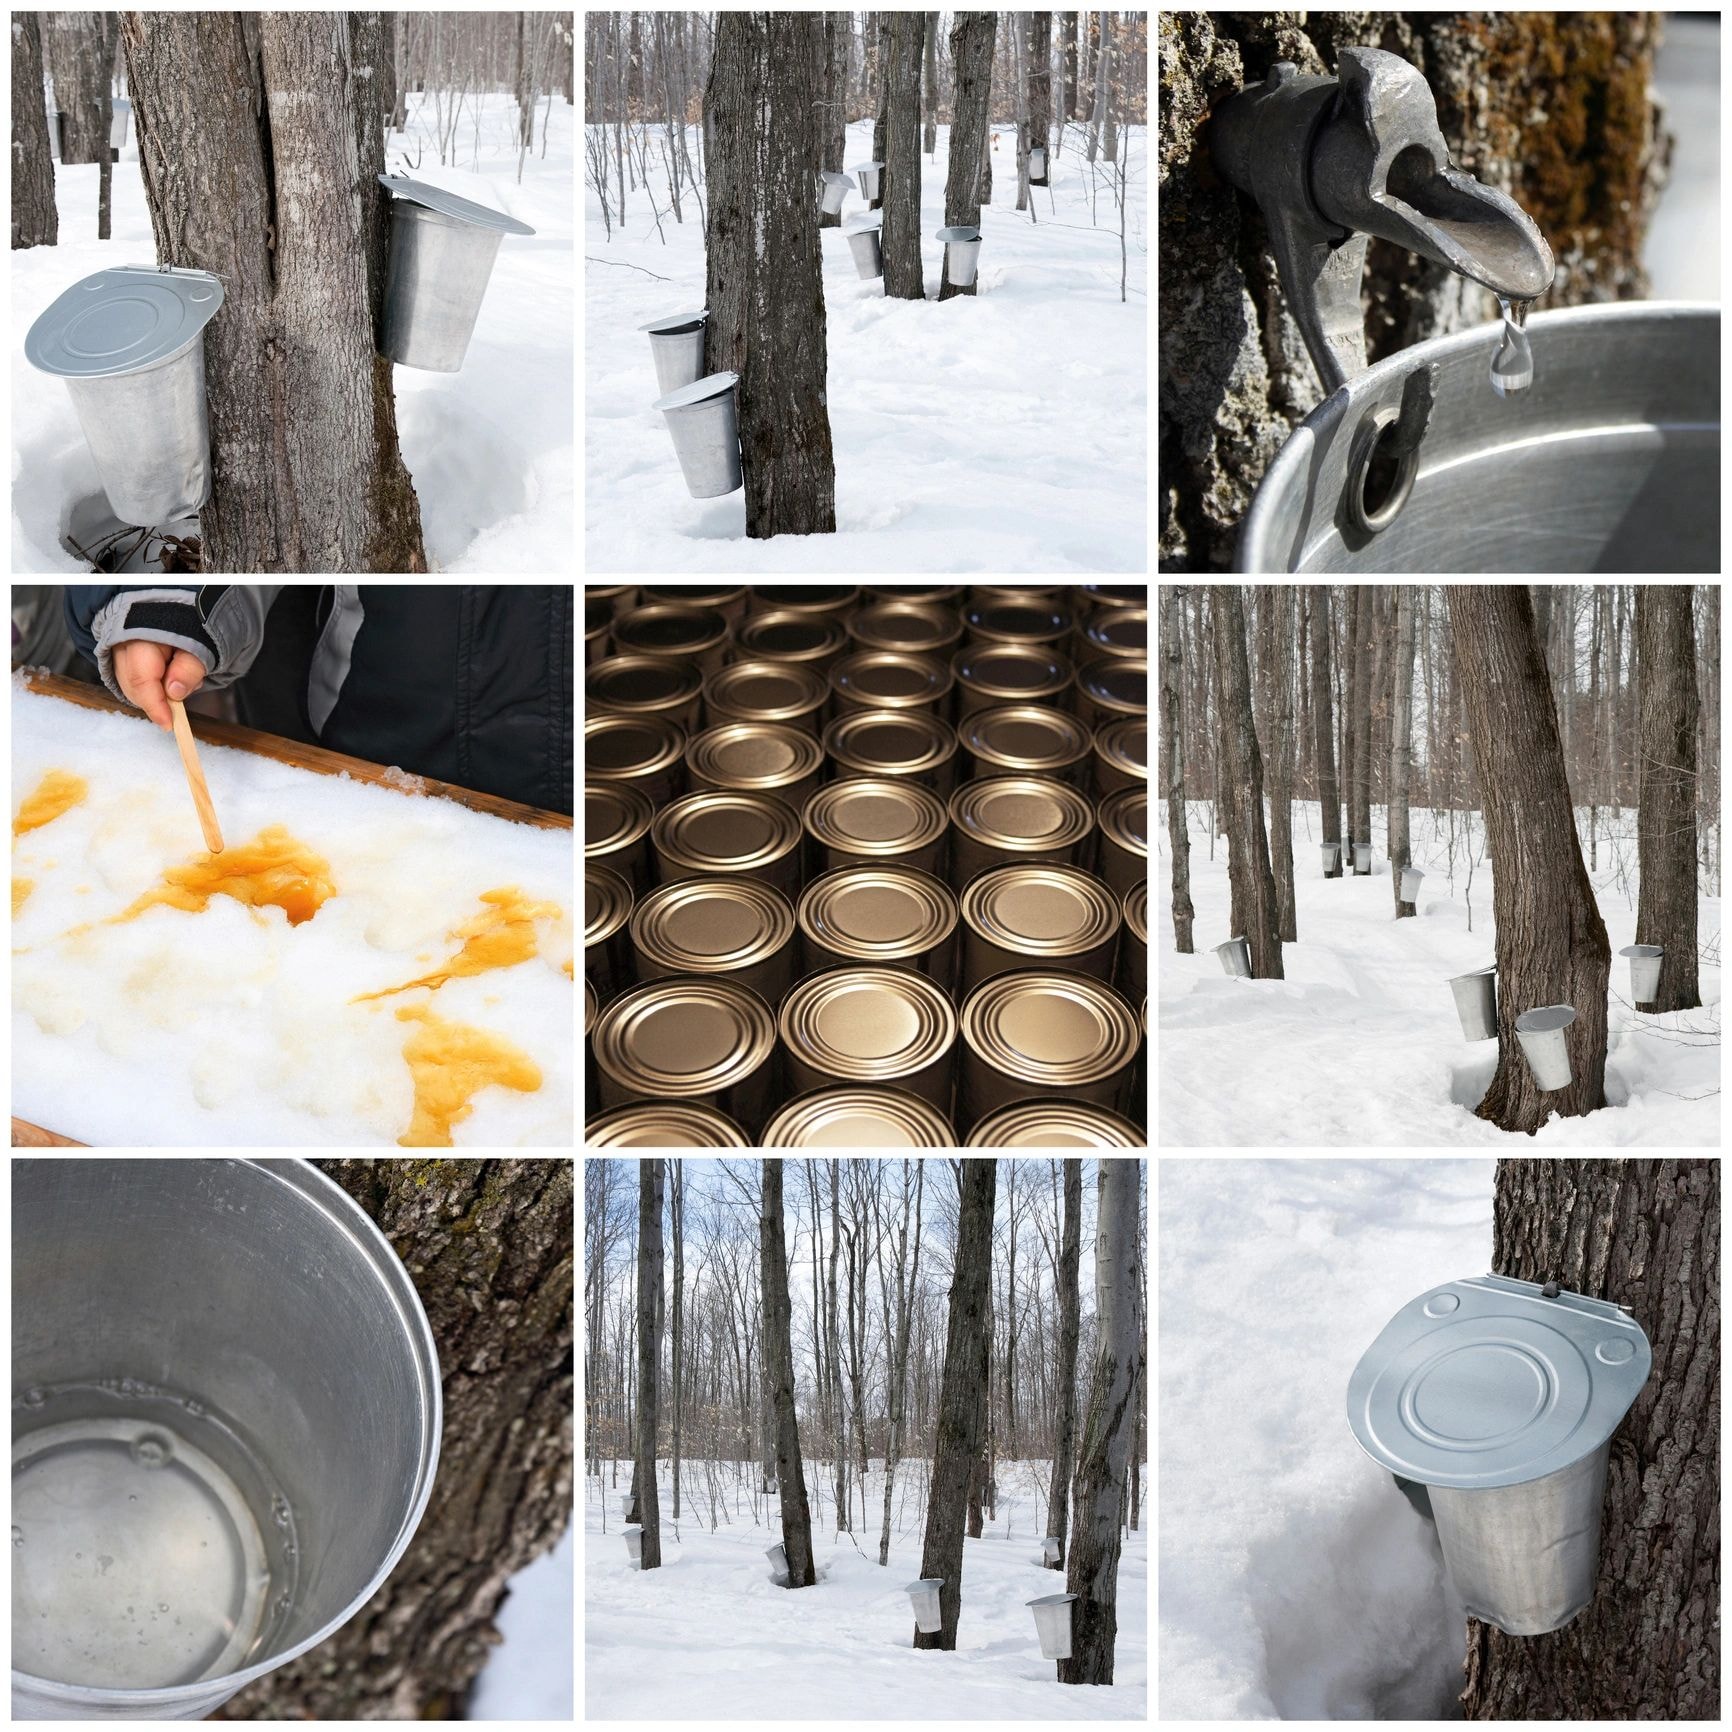
Filtering is where raw syrup becomes finished product. SHMU tracks each filtering pass — the volume in, the volume out, the filter type used, and any losses to niter. Your filtering records connect directly to your bottling records so the chain of custody from evaporator to bottle is complete and unbroken. Know exactly what you put through the filter and what came out the other side.

09
Bottling
The bottling tab records every bottle you fill. Log the container size, the grade, and the quantity. SHMU tracks your finished goods inventory in real time — every bottle that goes in is counted, and every bottle that sells comes off the total. Your bottling records are the foundation of your inventory and your sales tracking.
10
Total Cost
SHMU aggregates every cost your operation generates — fuel, supplies, equipment — and presents your total cost of production in one place. See your gallons of sap per tap for the season and your total season spend. New cost items entered this season are kept separate from prior years, so you can see exactly what this season cost without prior years clouding the picture. These numbers are calculated automatically from the data you've already entered elsewhere in the app. No double entry. No spreadsheets. Just the real cost of your season.


11
Inventory
Your inventory is a live count of every bottle, jug, and container you have on hand, empty or full — broken down by size and grade with customized pricing. SHMU updates it automatically as you bottle and as you record sales. You always know what you have and what grade it is. No more counting shelves before a market. Your inventory is always current.
12
Total Sales
Record every sale or gift — the date, the buyer, the product, the quantity, and the price. SHMU totals your revenue automatically and tracks it against your cost of production so you always know where you stand. See your sales by product size, by grade, or by customer. Your total sales number is always live and always accurate.


13
Loss
Loss happens in every operation — syrup lost to niter, to spills, to syrup burned up in a pan, to testing. SHMU tracks it all. Log every loss event with a cause and a volume. Your total loss is factored into your season yield calculations so your numbers are always honest. Knowing where your losses come from is the first step to reducing them.
14
The Journal
The journal is your daily record of everything — and it happens automatically. You enter the data and the journal creates it and records it. Every step of the way. This is where the slogan comes from. "It All Starts With Ū" — you are the sugar master. Every minute matters and every ounce counts.


15
The Burn Rate
The burn rate screen takes your sap data and your evaporation data and puts them together. If your burn rate is climbing, SHMU will show you. If a change you made improved your efficiency, SHMU will show you that too. This is the number that separates a profitable operation from one that's burning money along with the wood.
16
The Rule of 86
The Rule of 86 is the sugarmaker's formula — divide 86 by the sugar content of your sap to get the number of gallons of sap required to make one gallon of syrup. SHMU applies this calculation automatically to every sap collection entry you make. See your theoretical yield versus your actual yield for every boil. The gap between those two numbers is where your operation lives.


17
The Season History
Every season you complete in SHMU becomes a permanent record. Use this screen for at-a-glance numbers to see where you are at — sap volume, syrup yield, tap count, fuel used, total cost, total revenue. The longer you use SHMU, the more valuable this screen becomes.
18
The Equipment Log
Log every piece of equipment in your operation — your evaporator, your RO unit, your pumps, your tubing system. Record the make, the model, the purchase date, and the purchase price. Equipment data — know how many hours or gallons a certain piece of equipment has logged. This gives you real data (which may fetch a higher asking price) when you are ready to sell equipment and move up to something newer and bigger.


19
Low Stock Alerts
Set a minimum threshold for any empty container size in your inventory — from sample bottles to barrels — and SHMU will alert you when you're running low. Never get caught without your best-selling size because of inventory management. Low stock alerts are your early warning system — set them once and let SHMU watch your shelves for you.
20
Inventory Screen
Your inventory screen gives you a live count of every bottle, jug, and container on hand — empty or full — broken down by size and grade with your customized pricing. SHMU updates it automatically as you bottle and as you record sales. You always know exactly what you have and what grade it is. No more counting shelves before a market. Your inventory is always current.
21
Sales Screen
Record every sale or every gift — the date, the buyer, the product, the quantity, and the price. SHMU totals your revenue automatically and tracks it against your cost of production so you always know where you stand. Your total sales number is always live and always accurate.
22
Season Summary
At the end of every season, SHMU generates a complete season summary — total sap collected, total syrup produced, total taps, and total fuel consumed. Every number on the summary page is calculated from the data you entered throughout the season. Print it, save it, or share it. With all of the data you built, you can generate an AI summary by asking questions and it will give you a season overview, scaling suggestions, and equipment recommendations. This is the document that tells the story of your season in full — and what could be a bigger, faster sugarbush in the future.


23
Season Recall
Every season you run in SHMU is saved and retrievable. Season recall lets you go back to any completed season and review the full record — every boil, every sap run, every number you entered. Nothing gets lost. Nothing gets overwritten. Your history is yours to keep. See your total hours for each step along the way. Based on similar weather patterns, SHMU can show you peak dates and the optimal tapping window to plan for next year — of course, weather will always have the final say.
Built for the Long Run — Your Data. Your App. Forever.
Sugar Makers Harvest was built to last — not just for this season, but for every season you will ever run.
Main Menu — Backup & Restore
Your data lives on your phone. Nobody else has access to it — not us, not anyone. That is by design. We strongly recommend backing up daily.
65,000+ Lines of Code
SHMU isn't a weekend project. It's a deeply engineered application — over 65,000 lines of code built to handle the full complexity of a real maple syrup operation.
Sugar Makers Harvest — It All Starts With Ū
SHMU is built for the people who do the work — the sugarmakers who wake up before dawn, check the forecast, and head into the woods. This app is for you.